Hydrologists are often asked to determine how often a flood of a given discharge or stage will occur. For example, the 100-year flood stage is commonly used in land use zoning.
Plots of flood recurrence intervals are also helpful in demonstrating the hydrologic impacts of dams. In this example we will see a dam on the Black River in central Vermont has changed the flood frequency downstream of the dam.
Flood recurrence intervals are best determined from records of annual peak discharges. For 26,000+ streams with a U.S. geological stream gage, annual peak discharges are freely available on the web at:
http://nwis.waterdata.usgs.gov/usa/nwis/peak
For the Black River, the annual peak stream flow data are available at
http://nwis.waterdata.usgs.gov/nwis/peak/?site_no=01153000&agency_cd=USGS&
A plot of the annual peak discharges clearly demonstrates the impact of the dam; notice the sharp decrease in both magnitude and variability of peak discharge after the dam was built in 1964.
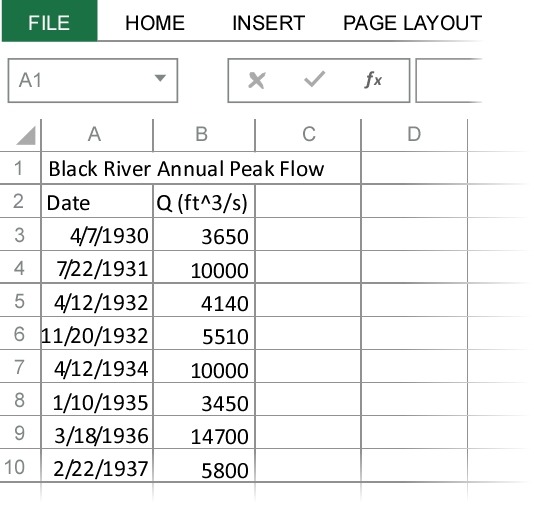
Note the option to download the annual peak discharge data as a tab-separated file. This makes it easy to import this data into Excel. The annual peak stream flow in ft3/s are given in the column labeled "peak_va". The dates for these flows are given in the column labeled "peak_dt". Copying only these columns, the file of imported annual peak discharges looks as shown below
1) Begin by creating a column of recurrence intervals. For example, you might want decide to determine the discharges having recurrence intervals of 2, 10, and 100 years. Place the cursor next to the cell for the 2 year recurrence interval and select the Insert Function command. Select the HydroToolBox category and then the LogPearson() function (see Log Pearson Type III Distribution in the reference section). Enter the cells with the annual peak discharges, only including the pre-dam years.
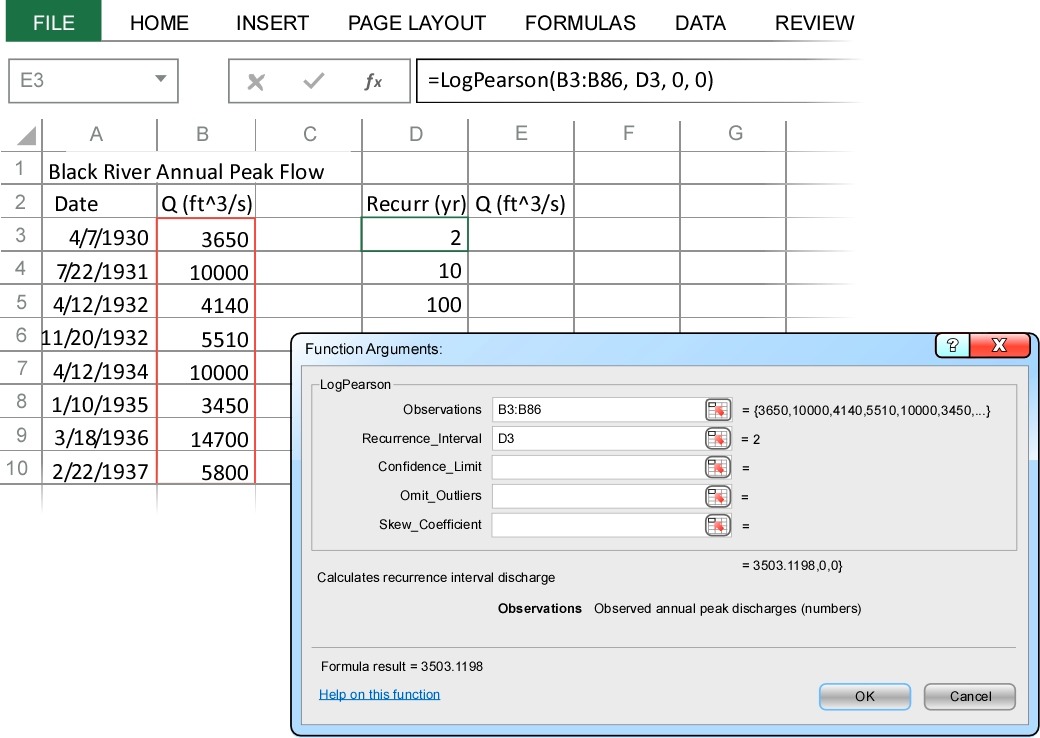
When you press OK, the function returns the discharge having a 2-year recurrence interval, i.e., the 2-year flood based on the pre-dam hydrology.
2) Repeat step (1) for each recurrence interval. Then re-calculate the recurrence intervals using only the post-dam data.
The final result is shown below.
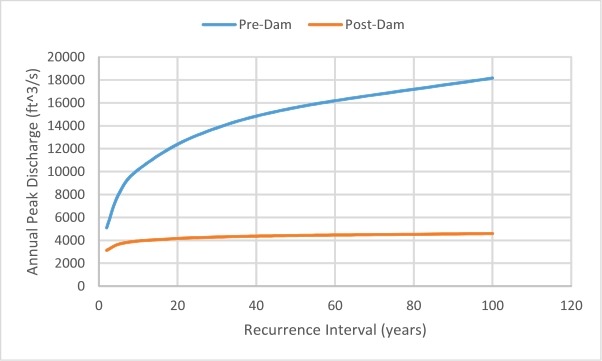
Notice how the post-dam 100-year flood is less than the pre-dam 2-year flood!