|
LogPearson(Observations, Recurrence_Interval, [Confidence_Limit], [Omit_Outliers], [Skew_Coefficient)
Returns estimated observed value for given recurrence interval using Log Pearson Type III distribution.
Input: Observations = List of observations such as annual peak discharge (numbers)
Recurrence_Interval = Recurrence interval for which to estimate the observed value
Confidence_Limit (optional) = Fractional probability for calculating upper and lower
Omit_Outliers (optional) = Set equal to one to automatically omit outliers, zero not to omit.
Skew_Coefficient (optional - see below) = Skew coefficient for the distribution of Output:
Predicted observation for given recurrence interval calculated using the |
Notes:
• To return confidence interval discharges, see the Vector Functions reference
• See Log Pearson Type III Distribution in reference for additional information on its use and application.
• Outliers are detected and omitted following the procedure described in "Guidelines for Determining Flood Flow Frequency" (Bulletin 17B of the Hydrology Committee, U.S. Geological Survey, Reston, VA). The current version of this function does not attempt to correct outlier values for the length of the historic record.
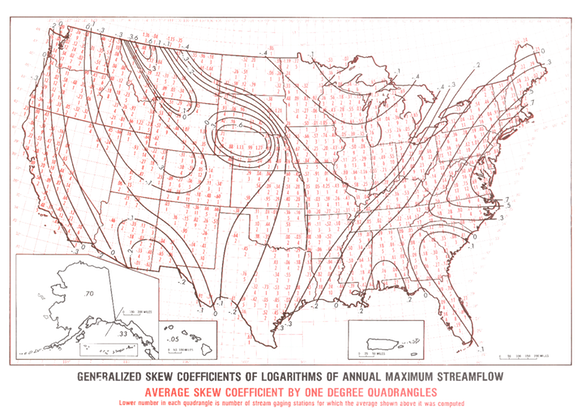
• Estimation of the skew coefficient of the peak discharge distribution from the peak discharge data is sensitive to extreme events. Thus it can be difficult to obtain accurate estimates of this parameter is the number of years of peak flow data is small. The Interagency Advisory Committee on Water Data ("Guidelines for Determining Flood Flow Frequency", Bulletin 17B of the Hydrology Committee, U.S. Geological Survey, Reston, VA) provides guidelines on how to improve the skew estimate by pooling information from nearby sites. Alternatively, skew coefficients for the continental U.S. may be estimated from generalized map (shown below) developed by Clayton Hardison ("Generalized skew coefficients of annual floods in the United States and their application", Water Resources Research 10(4):745-752, 1974) (Click on image to enlarge)
• The LogPearson() function has been validated against published flood frequency case studies.